Simultaneous Nadir Overpasses (SNOs) Predictions
Prediction of SNOs between NPP and GCOM-C Satellite Orbit:
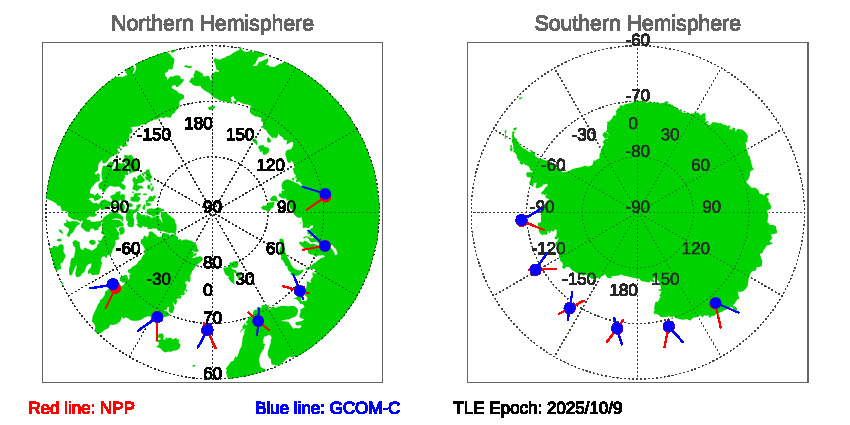
Table of predicted SNOs for the next 14.0 days since TLE Epoch: 10/9/2025
| Index | Date (NPP) | Time (NPP) | Lat,Lon (NPP) | SZA (NPP ) | Date (GCOM-C) | Time (GCOM-C) | Lat,Lon (GCOM-C) | SZA (GCOM-C ) | Distance(km) | Time Diff (sec) |
| 1 | 10/19/2025 | 05:19:54 | 69.48, 97.96 | 79.45 | 10/19/2025 | 05:21:04 | 69.45, 99.35 | 79.45 | 54.27 | 70 |
| 2 | 10/19/2025 | 06:10:30 | -69.05, -94.10 | 100.97 | 10/19/2025 | 06:11:42 | -69.02, -93.88 | 100.99 | 9.44 | 72 |
| 3 | 10/19/2025 | 07:01:13 | 68.90, 73.41 | 78.90 | 10/19/2025 | 07:02:11 | 68.91, 73.36 | 78.92 | 2.40 | 58 |
| 4 | 10/19/2025 | 07:51:57 | -68.89,-119.26 | 101.10 | 10/19/2025 | 07:52:41 | -68.91,-119.26 | 101.07 | 2.77 | 44 |
| 5 | 10/19/2025 | 08:42:42 | 68.85, 48.10 | 78.88 | 10/19/2025 | 08:43:09 | 68.86, 48.05 | 78.89 | 2.46 | 27 |
| 6 | 10/19/2025 | 09:33:26 | -68.84,-144.57 | 101.13 | 10/19/2025 | 09:33:39 | -68.86,-144.58 | 101.11 | 2.29 | 13 |
| 7 | 10/19/2025 | 10:24:11 | 68.79, 22.80 | 78.85 | 10/19/2025 | 10:24:07 | 68.80, 22.74 | 78.85 | 2.66 | 4 |
| 8 | 10/19/2025 | 11:14:55 | -68.78,-169.87 | 101.15 | 10/19/2025 | 11:14:37 | -68.80,-169.89 | 101.14 | 1.90 | 18 |
| 9 | 10/19/2025 | 12:05:41 | 68.80, -2.58 | 78.88 | 10/19/2025 | 12:05:04 | 68.80, -2.51 | 78.88 | 2.84 | 37 |
| 10 | 10/19/2025 | 12:56:24 | -68.73, 164.83 | 101.18 | 10/19/2025 | 12:55:35 | -68.74, 164.80 | 101.17 | 1.63 | 49 |
| 11 | 10/19/2025 | 13:47:10 | 68.74, -27.88 | 78.85 | 10/19/2025 | 13:46:02 | 68.74, -27.82 | 78.84 | 2.56 | 68 |
| 12 | 10/19/2025 | 14:37:50 | -68.52, 139.73 | 101.36 | 10/19/2025 | 14:36:36 | -68.52, 139.28 | 101.37 | 18.72 | 74 |
| 13 | 10/19/2025 | 15:28:22 | 67.83, -52.07 | 77.99 | 10/19/2025 | 15:27:14 | 67.87, -54.17 | 77.98 | 87.76 | 68 |
Figure of NPP and GCOM-C satellite orbits during SNOs since TLE Epoch: 10/9/2025
 Download SNOs between NPP and GCOM-C since TLE EPOCH: 10/09/2025 in txt file.
Historial Predications of SNOs between NPP and GCOM-C

